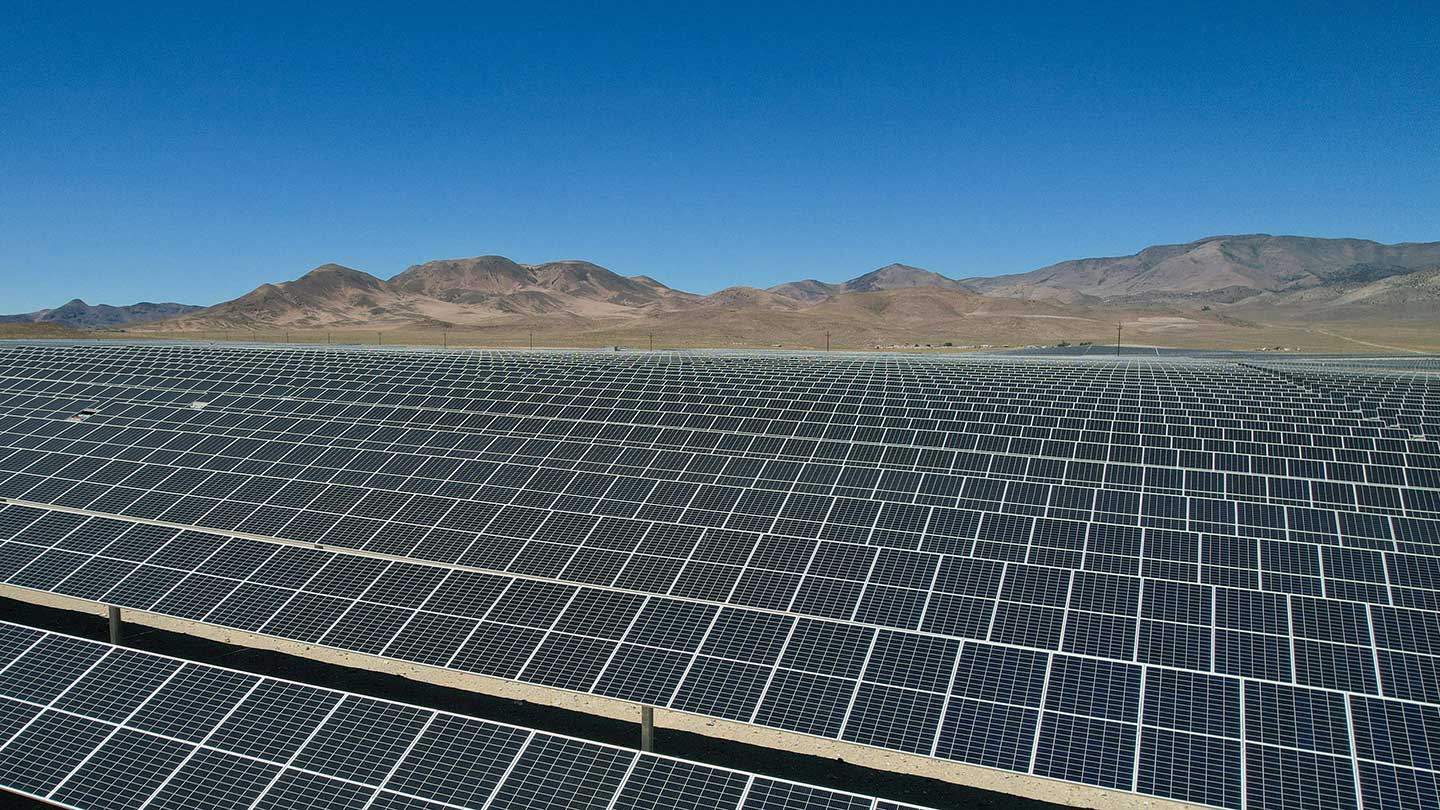
Designing Commercial and Utility-Scale Solar Systems: What Matters Most

Quick Answer
For developers and EPCs, designing utility-scale solar systems comes down to seven decisions: an accurate site assessment, row spacing and GCR tuned for energy and cost together, electrical design built into the layout, an early call on battery storage, site-specific energy modeling, lifecycle cost rather than capital cost, and interconnection and permitting limits built in from day one. Commercial systems follow the same physics with different priorities. In both, terrain-aware optimization, not maximum capacity, is what keeps hidden civil costs out of the project.
Commercial vs Utility-Scale: The Same Physics, Different Priorities
Designing commercial and utility-scale solar systems is not simply a matter of scaling up a rooftop array. The number of variables rises steeply with project size, and so does the cost of getting them wrong.
Commercial and utility-scale solar projects share the same components: modules, racking, inverters, cabling, and protection equipment. What differs is the system's purpose and what counts as success.
Commercial Solar Systems
A commercial solar system is usually sized around a building's energy consumption and demand profile. Smaller businesses typically install systems of 50–250 kW, while larger industrial sites may exceed 1 MW, as we covered in our guide to commercial solar energy. The goal is to offset purchased electricity, reduce demand charges, and deliver a return on investment within the owner's business planning horizon. Roof layout, structural capacity, and on-site consumption are the defining constraints. Unlike residential systems, commercial arrays often span large flat roofs, carports, or adjacent land.
Utility Scale Solar Projects
Utility-scale projects are a different category. A utility-scale PV plant exports its output to the grid under a power purchase agreement or to a wholesale market and is judged by levelized cost of energy (LCOE), annual energy yield, and bankability. As our introduction to utility-scale solar projects explains, these plants typically run at tens or hundreds of megawatts and behave like any other power plant on the grid, with matching obligations. Terrain, interconnection, and constructability dominate.
The design principles below apply across both. What changes is the weighting.
1. Site Assessment Sets the Ceiling for Everything Else
No design can outperform its site. A thorough site assessment establishes the real buildable area, the solar resource, and the constraints that will shape all subsequent decisions.
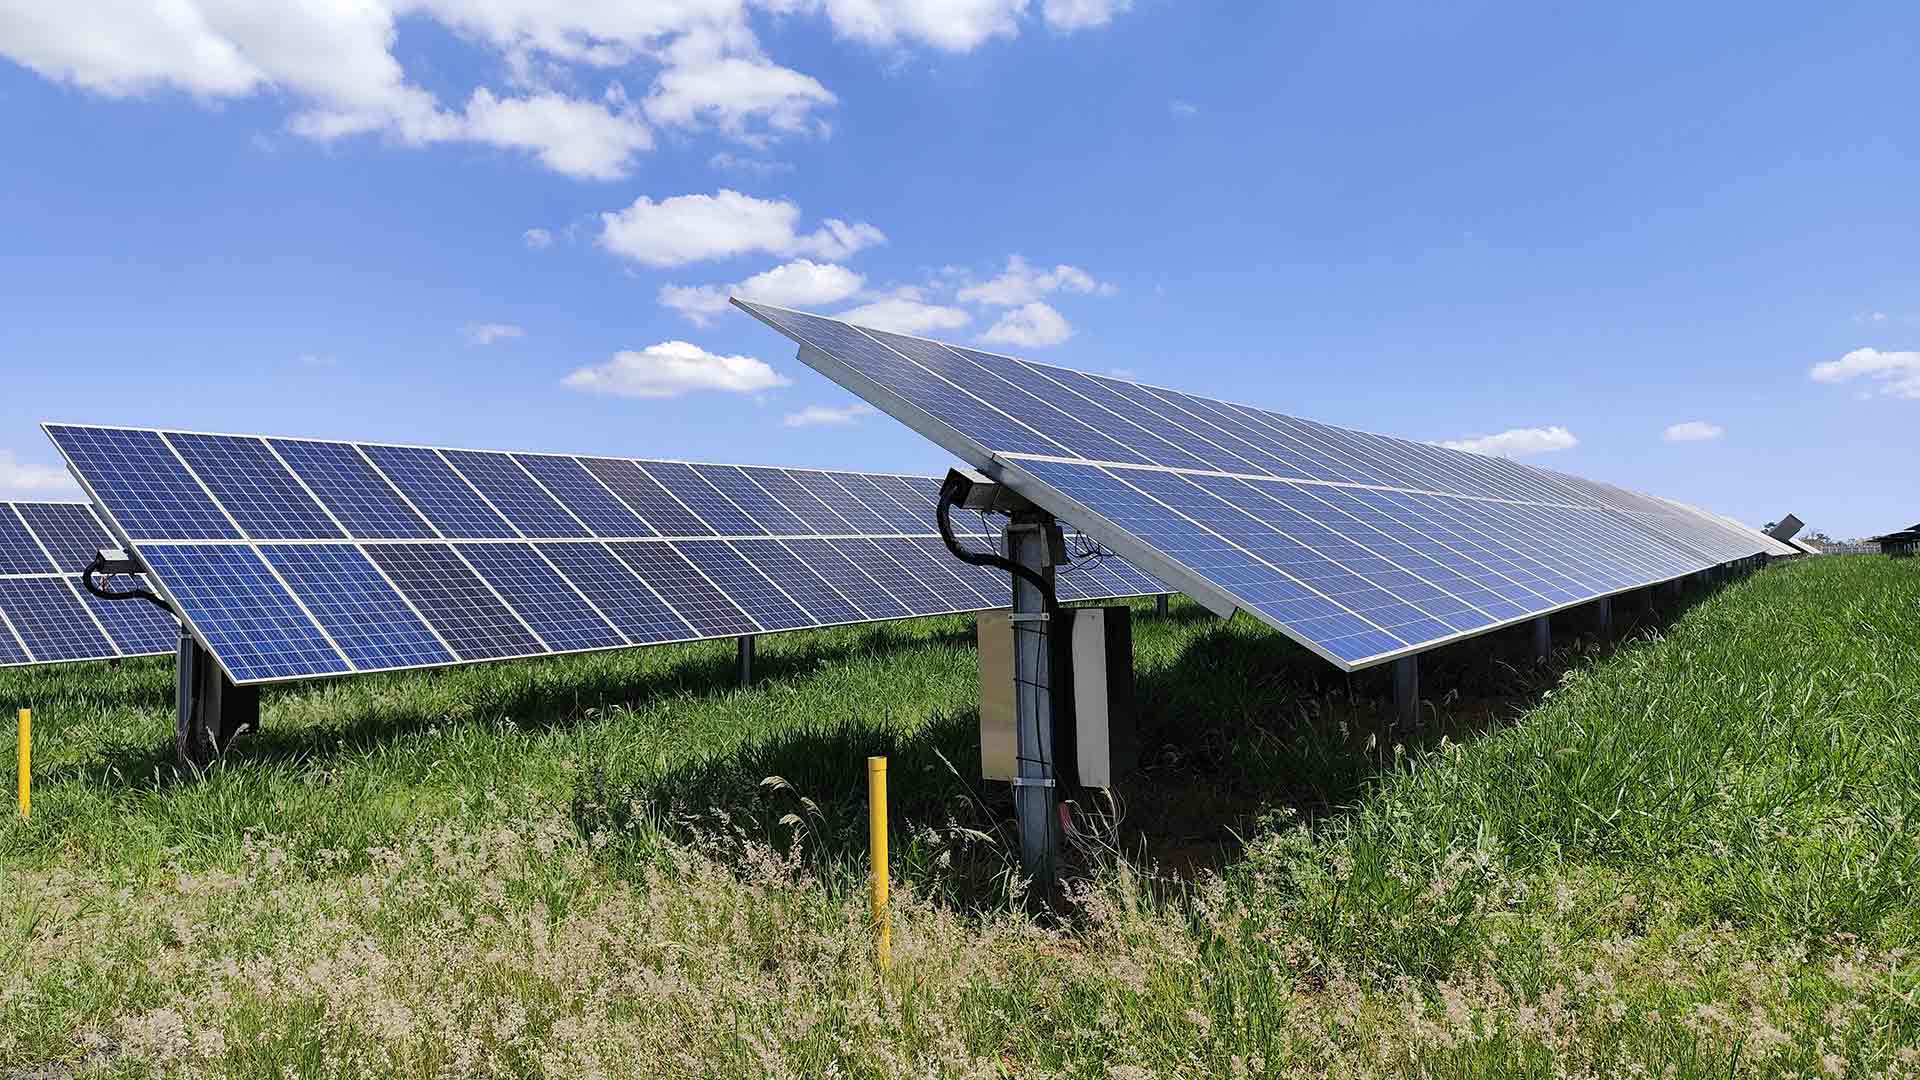
For a utility-scale solar project, that means high-resolution topography (typically LiDAR), geotechnical data, hydrology and drainage, wetlands and environmental constraints, easements, setbacks, and access routes. Slope matters enormously. Single-axis trackers, which now account for almost all new US utility-scale capacity (99% of new capacity in 2024, per Berkeley Lab), have slope tolerances that determine whether rows can follow the ground or whether the site needs grading, taller piles, or lost rows. Our solar PV layout design guide for utility-scale projects outlines a comprehensive pre-design checklist.
For commercial rooftop work, site assessment focuses on the roof itself: its structural load capacity, remaining membrane life, drainage, parapets, rooftop equipment, and the fire access pathways required under Section 1205 of the International Fire Code as adopted and amended by the local authority having jurisdiction (AHJ). A roof layout that ignores fire pathways or a roof due for replacement in five years is a design that will be redone.
What matters most: Constraint data first, layout second. Every hour spent on accurate site data saves days of redesign later.
2. Layout, Row Spacing, and Inter-Row Shading
Once the buildable area is known, the central question is how densely to pack it, which is governed by the ground coverage ratio (GCR) and row spacing.
Tighter rows fit more modules and more DC capacity onto one project site. But closer spacing increases inter-row shading, particularly early and late in the day and in winter, when the sun is low. On trackers, backtracking algorithms rotate rows away from the optimal angle to avoid shading neighboring rows, trading some irradiance for the avoidance of much larger shading losses. On uneven terrain, standard backtracking can still leave rows shading one another unless the algorithm accounts for the actual ground profile.
Typical GCRs sit around 0.30–0.40 for fixed-tilt systems and 0.40–0.50 for single-axis trackers, but the right value is project-specific. It depends on latitude, terrain, land cost, module price, and the value of energy at different times of day.
For commercial roofs, low-tilt racking arranged in east–west or south-facing configurations involves the same trade-off in miniature. An east–west layout fits more modules on a roof and spreads solar generation across the day, while a south-facing layout produces more energy per module.
What matters most: Optimize GCR and row spacing for energy yield and cost together, using hourly shading analysis on real terrain rather than a single design-day sun angle.
3. Electrical Design: DC Capacity, Inverters, and Losses
Electrical design turns a layout into a functioning power plant. The key decisions are string sizing, inverter selection, the DC/AC ratio, and the collection system.
String Sizing
String sizing must respect both voltage limits. A module's open-circuit voltage rises in cold weather, so the maximum string length is set by the lowest expected site temperature under NEC 690.7. In hot weather, voltage falls, so strings must also stay above the inverter's minimum MPPT voltage.
Inverter Architecture
Inverter architecture is a genuine design choice. Central inverters remain common on large sites, but string inverters are increasingly used in utility-scale solar and commercial projects. They offer greater MPPT granularity on complex terrain, simpler replacement, and less production loss when a single unit fails, although they require more units and more AC cabling. The right choice depends on terrain, layout, O&M strategy, and cost.
The DC/AC Ratio
The DC/AC ratio (inverter loading ratio, or ILR) determines how much DC capacity is paired with each unit of inverter capacity. Oversizing the DC side lets the plant reach full AC output earlier in the day and hold it longer, at the cost of clipping some midday energy. Lawrence Berkeley National Laboratory data shows the average ILR for US utility-scale projects has held steady since 2017, with a median of 1.34 for projects built in 2023. That is a benchmark, not a rule. The best ratio depends on module and inverter costs, interconnection limits, and whether a battery can capture clipped energy. Our guide to DC-to-AC ratio optimization goes deeper.
What matters most: Treat electrical design as part of the layout, not a step that follows it. Row placement, string routing, and equipment location should be optimized together.
4. Battery Energy Storage Is Now a Core Design Consideration
Energy storage is no longer an optional extra. EIA expects 24 GW of battery storage to come online in 2026, and LBNL reports that nearly half of the solar capacity in US interconnection queues is proposed as a hybrid with battery storage.
Integrating battery energy storage changes the design brief. DC-coupled systems can capture energy that would otherwise be clipped, thereby justifying a higher ILR. AC-coupled systems offer more operational flexibility and simpler retrofits. Either way, the storage yard needs space, access, fire separation, and a place in the electrical single-line diagram, all of which interact with the PV layout.
For commercial customers, battery storage is often driven by demand-charge reduction and resilience. For utility-scale plants, it is increasingly driven by capacity value, time-shifting solar generation into evening peaks, and interconnection constraints. Because battery size, ILR, and export limits all affect one another, the best results come from optimizing storage sizing alongside the PV layout rather than adding it afterward.
What matters most: Decide early whether storage is in scope, or likely to be later, and reserve the space and electrical capacity for it in the initial design.
5. Energy Production Modeling and Long-Term Performance
Every design decision is ultimately judged on energy production, and energy models are only as good as their inputs. Irradiance data, horizon and near shading, soiling, module mismatch, wiring losses, availability, and degradation all feed the annual energy estimate that lenders and offtakers rely on.
Capacity factors vary widely with location and technology. LBNL finds that US utility-scale PV capacity factors range from roughly 17% in the least-sunny regions to above 30% in the sunniest regions, with tracking adding several percentage points where the resource is strong. A design optimized for one site will not transfer unchanged to another. Newer plants are also falling short of their own models: Berkeley Lab found a median first-year performance index of 93% for plants built in 2022, with weather impacts and sub-hourly clipping that hourly models miss among the possible causes.
Long-term performance also depends on choices that are easy to overlook at the design stage: module glass thickness and hail risk, tracker stow strategy, vegetation management, drainage, and access for maintenance crews. These shape system performance and operating expenses over the life of the project.
What matters most: Use site-specific loss assumptions, model P50 and P90 cases, and design for maintainability as well as first-year yield.
6. Balancing Upfront Cost Against Operating Expenses
The cheapest system to build is rarely the cheapest system to own. Berkeley Lab puts the capacity-weighted installed cost of US utility-scale PV at $1.61/WAC ($1.22/WDC) in 2024, down 73% since 2010, with median O&M costs of about $11/kWAC per year. Costs are now moving the other way: SEIA and Wood Mackenzie put single-axis tracker system pricing at $1.35/Wdc in Q4 2025, up 14% year over year, with electrical and structural costs up about 20%, driven largely by import tariffs.
Design choices move both numbers. Aggressive grading can lower pile costs but raise civil costs and erosion risk. Higher GCR increases installed capacity but may increase shading losses and cleaning needs. Cheaper components may lower upfront costs but increase failure rates, insurance premiums, and O&M spending. A sound design accounts for the full lifecycle, not just the construction budget.
For commercial projects, the financial case also depends on modeling consumption, tariff structure, and demand charges alongside system output.
What matters most: Evaluate design alternatives on LCOE and project value rather than on capital cost or capacity alone.
7. Grid Integration and Regulatory Requirements
A design is only viable if it can connect to the grid and secure its permits. For utility-scale projects, interconnection is often the longest step. Berkeley Lab’s Queued Up: 2026 Edition finds 2,061 GW of generation and storage capacity waiting in US interconnection queues at the end of 2025, with a median of more than five years from interconnection request to commercial operation, and only around 13% of capacity requested between 2000 and 2020 having reached operation.
The interconnection agreement defines the plant's export limit, reactive power requirements, and point of interconnection, all of which feed back into electrical design, substation layout, and ILR. Regulatory requirements such as zoning, environmental permits, stormwater rules, and local setbacks add further constraints.
Policy is also reshaping design timelines. Under the One Big Beautiful Bill Act (H.R. 1), solar projects that began construction after July 4, 2026, must be placed in service by the end of 2027 to claim the Section 48E or 45Y credits, and new foreign-entity sourcing restrictions apply to equipment. Energy storage retains its credits on the original phase-down schedule, including storage co-located with solar. For developers, the ability to finalize a buildable design quickly has become a direct financial lever.
What matters most: Build interconnection limits and permitting constraints into the design from the start, and keep the design flexible enough to respond when they change.
Industry Trends Raising the Bar for Solar Design
Several industry trends are making design quality more important:
- Scale: Solar made up 54% of all new US generating capacity in 2025, according to SEIA, and the US Energy Information Administration expects a record 86 GW of additions in 2026, led by 43.4 GW of utility-scale solar. SEIA also projects that cumulative US solar capacity will grow from 279 GWdc at the end of 2025 to 769 GWdc by 2036. More utility-scale solar power means more pressure on design teams.
- Harder sites: Flat, well-connected sites are increasingly scarce. New projects increasingly sit on rolling terrain, brownfield land, or constrained parcels. Development has also moved into less sunny regions: the long-term solar resource at sites built in 2024 averaged 4.75 kWh/m²/day, down from a 2014 peak (Berkeley Lab).
- Hybridization: Solar-plus-storage is becoming the default design case in many markets.
- Compressed timelines: Tax-credit deadlines and interconnection milestones leave little room for slow, sequential design cycles.
- Rising demand: Data centers and electrification are driving new demand, and utilities are looking for capacity that can be built quickly.
Why Integrated Design and Engineering Review Matters
Across all the areas above, the common thread is interdependence. Terrain affects row spacing. Row spacing affects shading and DC capacity. DC capacity affects inverter loading and clipping. Clipping affects the value of storage. Everything affects cost and the subsequent engineering review.
In a traditional workflow, those disciplines work in sequence and in separate tools, and each handover adds days or weeks. Teams can afford only a handful of iterations, so the first workable design often becomes the final one. We explore this problem in more depth in utility solar design challenges and how to solve them faster.
The alternative is to create and evaluate designs in which civil, electrical, and energy analyses are updated together. When a design team can see the effect of a change in row spacing on grading, cable costs, annual energy, and LCOE in minutes, it can test dozens of options instead of a few.
How PVFARM Helps Teams Design Better Solar Projects, Faster
PVFARM is utility-scale solar design software built as a decision intelligence layer: one connected project model that brings terrain-aware layout, grading, tracker, and fixed-tilt configuration, electrical design, energy simulation, and project economics together, with engineering-grade detail at the speed of the cloud. PVFARM customers evaluate 10 to 20x more design alternatives earlier in the cycle while keeping designs buildable, and the platform is used by more than half of the top U.S. utility-scale EPCs as part of their workflow.
Instead of passing files between disciplines, developers and EPCs can test GCR, row spacing, string configuration, inverter choice, and ILR against real site conditions and see the impact on energy production and cost as the design changes. As we explain in our overview of utility-scale solar design software for EPCs and developers, this integrated approach helps teams identify high-risk sites early and move from prospecting to bankable design with confidence. Engineers stay in control throughout; the software automates repetitive tasks and provides them with better information earlier.
RE PILOT
For solar-plus-storage projects, PVFARM has now launched RE PILOT, a utility-scale solar and storage optimization platform, commercially. RE PILOT explores millions of viable PV and PV + BESS configurations in a single workflow, testing ILR, GCR, pitch, racking, modules, inverters, battery size, and export limits together to find the designs with the best LCOE and project value. It works alongside RE STACK for BESS layout and the PVFARM engineering platform for detailed design.
That combination of speed and engineering rigor earned PVFARM Best-in-Show for Large Scale Solar in Solar Power World's 2025 Top Products awards.
Frequently Asked Questions
What matters most when designing utility-scale solar systems?
The decisions that matter most are site assessment, row spacing, and GCR, electrical design, battery storage, energy modeling, lifecycle cost, and interconnection and permitting. They are interdependent, so the best designs optimize them together and favor terrain-aware layouts over maximum capacity to keep civil costs in check.
How is commercial solar design different from utility-scale solar design?
Commercial systems are sized around a building’s consumption and judged on bill savings and payback, with roof structure and fire pathways as the main constraints. Utility-scale plants export to the grid and are judged on LCOE, energy yield, and bankability, so terrain, interconnection, and constructability are dominant considerations.
What ground coverage ratio is typical for utility-scale solar?
Typical GCRs run about 0.30–0.40 for fixed-tilt systems and 0.40–0.50 for single-axis trackers. The right value depends on latitude, terrain, land cost, module price, and the value of energy at different times of day; see our PV layout design guide.
What DC/AC ratio should a utility-scale solar project use?
There is no single right ratio. Berkeley Lab data put the median at 1.34 for U.S. projects built in 2023, and the fleet average has held steady since 2017. Module and inverter costs, interconnection limits, and DC-coupled storage that can capture clipped energy all shift the optimum.
How long does interconnection take for utility-scale solar?
For projects built in 2025, the median time from interconnection request to commercial operation was more than five years, according to Berkeley Lab’s Queued Up: 2026 Edition. About 2,061 GW of generation and storage were still waiting in U.S. queues at the end of 2025.
Should battery storage be included in the initial solar design?
If storage is in scope now or likely to be later, yes. Nearly half of the solar capacity in U.S. interconnection queues is proposed with storage, and battery size, ILR, and export limits affect one another, so reserving space and electrical capacity early avoids redesign. RE PILOT sizes PV and BESS together before detailed engineering.
How do federal tax credit deadlines affect solar design timelines?
Under the One Big Beautiful Bill Act, solar projects that began construction after July 4, 2026, must be placed in service by the end of 2027 to claim the Section 48E or 45Y credits. That compressed window makes the speed at which a buildable, permittable design is reached a direct financial lever.
Connect With Us
Ready to see what integrated solar design can do for your next project? Request a demo or contact our team today.
Related Reading
- Solar Farm Site Selection: The Complete Developer Checklist
- Utility-Scale Solar Project Development Stages: The Complete Timeline from Site Selection to COD
- Solar Tracker Comparison: Fixed Tilt vs Single-Axis vs Dual-Axis for Utility-Scale Projects
- Solar Farm Drainage Design: Stormwater Management for Utility-Scale Projects
- What Are the Biggest Risks in Solar Farm Development – and How Do You Manage Them